On March 27, 1964, at 5:36 p.m. AST, a full 600 miles of fault near Anchorage, Alaska suddenly ruptured, resulting in the second most powerful earthquake ever recorded.
Roughly four hours later, the first of four tsunami waves caused by the quake reached Crescent City, California.
The first wave resulted in localized flooding. The second and third were smaller than the first and had little effect.
The fourth wave struck the city with a height of about six meters — nearly 20 feet — after having pulled most of the water from the harbor.
After the dust had settled, the damage stood at twelve dead; over one hundred injured; 289 buildings destroyed;
100 cars and 25 large fishing ships crushed; and 60 blocks inundated with water, with 30 blocks beyond repair.
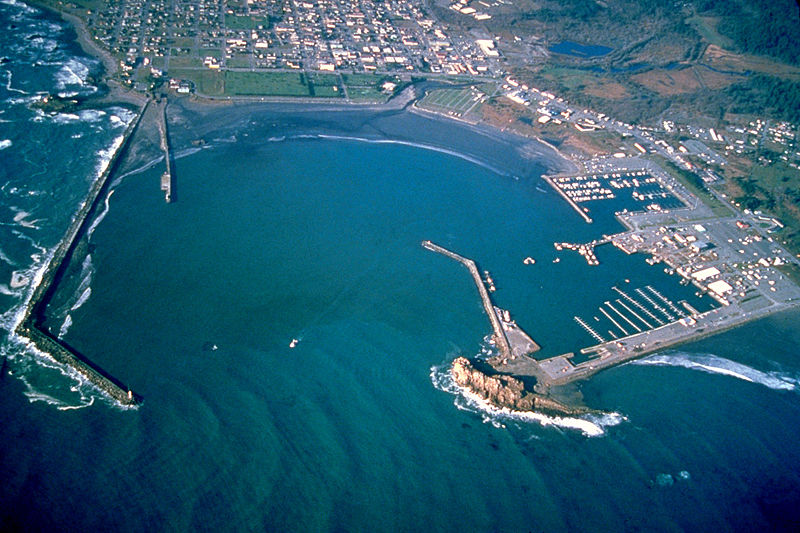
An aerial view of the Crescent City harbor. (Source: Wikipedia)
Due to its offshore geography, Crescent City — and especially its harbor, shown in the image to the right — are unusually susceptible to tsunamis.
Since 1964, the city has sustained damage from a number of additional earthquakes.
The 2005 Eureka earthquake that forced the entire city to evacuate.
In November 2006, an earthquake near the Kuril Islands in the western Pacific caused a tsunami that damaged multiple docks and boats.
The 9.0 earthquake that struck Japan on March 11, 2011 produced a tsunami that destroyed 35 boats and damaged the harbor severely.
To improve Crescent City’s disaster preparedness, researchers seek to better understand the impact of tsunamis arising from a variety of possible seismic events.
One approach is to use numerical simulations to predict tsunami damage.
The process begins by stipulating a slip pattern, which measures where and to what degree the ocean floor moves during the earthquake, and the location of the earthquake.
The slip pattern determines how water is displaced, leading to the initial formation of the tsunami.
The tsunami is then tracked from the epicenter of the seismic event, across the ocean, and into the Crescent City harbor to determine the degree of inland flooding, known as inundation. The inundation levels predicted by several simulations, each with different seismic events, are shown below.
Notice that the simulated tsunamis have vastly different impacts on Crescent City in terms of flooding.
In order to understand the “overall” tsunami risk posed to the city, we need to take into account the characteristics of each.
Seismic Event Types
The tsunamis which affect Crescent City are caused by seismic events that come in two flavors.
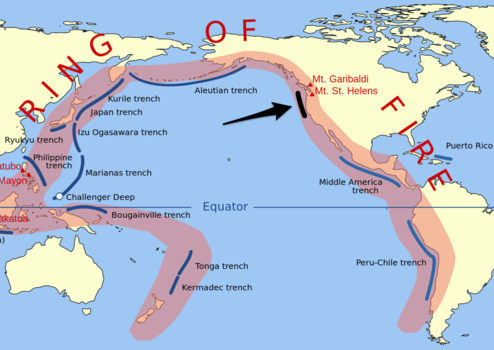
First, there are the near-field events originating in the (relatively) nearby Cascadia Subduction Zone.
Due to the nature of the local tectonic plates and the fact that these near-field events have a limited geographic area in which they can occur, they occur relatively infrequently.
Due to their proximity, near-field events tend to be extremely damaging. Because they originate nearby, tsunamis arising from near-field events reach Crescent City quickly, leaving inhabitants almost no time to evacuate.
Arrow shows the Cascadia Subduction Zone, in the context of other far-field subduction zones.
(Source: Business Insider)
Complementing near-field events are far-field events — tsunamis that arise from earthquakes far from Crescent City. These events can occur in a much broader range of locations, and so are more frequent.
However, a greater distance to the origin of the earthquake means that the resulting tsunamis usually have less severe effects. The far-field events in our simulations come from Alaska and the Aleutian Islands, Southern Chile, Kamchatka, the Kuril Islands, and Tohoku, Japan.
Within the categories of near-field and far-field, seismic events differ greatly in terms of how likely they are to take place.
Thus, associated with each simulated earthquake is its annual probability of occurrence:
an estimate of the chances that that event will happen sometime within a single year.
For example, an event with annual probability 1/20 has a one in twenty chance of occuring any given year.
It does not, however, guarantee that the event will occur in the next 20 years (more on this later). These probabilities are usually not known exactly, and must be estimated by experts.
Aggregate Inundation Maps
Since we do not know when or what type of seismic event will happen next, to form an overall picture of tsunami risk
we would like to combine the information from many simulations into a probabilistic inundation map -- an aggregate map that weighs the possible inundations at each point based on how likely each scenario is to occur.
We start by picking an annual probability, p, in which we are interested.
This probability is not the same as the annual probability of a single event — it instead represents the chance that any member from the collection of events occurs over the course of a year.
For each point in a region of the map we use the results of all the simulations to figure out the maximum amount of flooding that the
simulations predict could occur with probability at least p.
The result is a map that shows the “worst-case” amount of flooding one would expect to occur with annual probability p.
We can vary p to produce maps for any probability to understand how likely different levels of inundation are.
We show a collection of these inundation maps below.
A random selection of six of the individual simulations that informed the inundation map are also shown on the right, sorted by their annual probabilities. You can interact with the maps as follows:
You can modify the annual probability for the aggregate inundation map using the slider.
You can see how the map changes when you restrict to only near-field or only far-field events by clicking on different tabs.
Re-clicking on near/far-field tabs will randomly re-select the different individual simulations to show (if more are available).
If you are interested in a particular point, you can click it in the large map and the small maps will shift focus to your point.
Warning: the data is limited, so for some sets of events the aggregate map does not always change for different annual probabilities.
This is not due to an error in the map; instead it is because two annual probabilities produce nearly the same map.
Aggregate Probabilities
Individual Simulations
One thing you may have noticed is that, for any set of events you choose, the flooding gets worse and worse
as the annual probability goes down (try moving the slider from left to right to see this effect).
This is because the most extreme events tend to have lower annual probabilities, meaning that we can virtually ignore them
when considering high-likelihood scenarios. It is certainly good news for Crescent City!
Another observation you may have made is that the inundation maps are completely blank for some combinations of events and annual probabilities.
In particular, when you restrict your attention to just the near-field events and select high annual probabilities (1/50, 1/100, and 1/200),
the resulting inundation maps are blank. Because the odds of all the near-field events are so low, the amount of flooding expected with large annual probabilities is zero.
Interpreting Annual Probabilities
Annual probabilities can be a bit confusing and may seem misleading.
Just because a seismic event has an annual probability of 1/100, does not mean that the event will definitely occur in the next 100 years.
It turns out that the probability such an event occurs in the next 100 years is actually lower than 100% — instead it’s about 63.4%.
Test out some variations with the interactive probability explorer below.
You can try entering some of the annual probabilities from the simulated tsunamis to get an idea for how likely they are to occur in the next few years.
A good way to understand this counterintuitive effect is to think about an analogous example: flipping a coin. Say you have a fair coin, meaning that if you flip it you have a 50% chance of it landing on heads and a 50% chance of it landing on tails. Imagine that, once a year, the coin has the magical ability to predict whether a tsunami will strike Crescent City that year. On January 1st, if you flip the coin and it lands heads, then Crescent City will be hit with a tsunami that year, and if it lands tails the city will be spared for at least another year. We might then say that the annual probability of a tsunami damaging Crescent City is 1/2, or 0.5.
What are the odds the city experiences at least one tsunami in the next two years? It might seem like it should happen with 100% certainty, but that is not the case. In order for a tsunami to strike, at least one of the coin tosses needs to come up heads. In other words, they cannot both come up tails (if both tosses resulted in tails then no tsunamis would occur). The probability that both tosses are tails is easy to compute: it is the probability of tails on the first toss times the probability of tails on the second toss, or (0.5)(0.5) = (0.5)2 = 0.25. This means that there is a 25% chance that no tsunamis will occur over the next two years. If there is a 25% chance of no tsunamis then there is a 75% chance (100 minus 25) that a tsunami will happen.
What if we wanted to know the odds of tsunami taking place in the next three years? For one not to occur, we would have to flip tails three times in a row. Getting three tails in a row has probability (0.5)(0.5)(0.5) = (0.5)3 = 0.125. So there is a 12.5% chance that no tsunamis will arise, meaning there is a 87.5% chance (100 minus 12.5) that a tsunami will crop up. In general, we can compute the probability of a tsunami happening in the next n years by computing 1 - (0.5)n.
Final Notes
Due to the importance of estimating the hazards posed by tsunamis for evacuation and other emergency planning, FEMA and the State of California funded the research of Randy LeVeque et. al. that produced the simulations used in these visualizations. Crescent City was the focus of their project, where the inundation and probabilistic contour maps developed were strongly encouraged as "a product that supplements and aids in the practical interpretation of the same probabilistic information displayed in the standard 100- and 500-year tsunami maps." Many studies have demonstrated that interpreting static visualizations that convey uncertainty can be challenging. Static visualizations produced by the government that serve as warnings to homeowners and residents in Crescent City and other coastal cities would benefit from the tools of LeVeque et. al. and recent uncertainty visualization research. Future work would include developing similar probability and inundation contours for Washington State and determining which of the techniques presented here and in the literature would be most beneficial for public safety and preparedness.
Project Information
Team members
Kellie MacPhee
Brian de Silva
Abe Engle
Ben Liu
Abstract
Numerical simulations conducted by researchers at the University of Washington are used to model and predict the impact of tsunamis. By estimating the probability of occurrence of each simulated tsunami, the probability of exceeding a given level of inundation (flooding) can be estimated for every point in the landscape, giving rise to a hazard map. Visualizing hazard maps is difficult for several reasons. First, the data has a large amount of uncertainty: the probability of each simulated event must be estimated, and the hazard maps are also generated from a limited pool of simulated events, thus they may not account for the worst or most exotic tsunamis. Second, the resultant hazard maps specify a complex hazard function at every point, which describes the probability of inundation at every depth.
To effectively communicate the dangers and potential impacts of tsunamis to the general public, we employ interactive and research-driven design techniques to enhance users' understanding of the complex data. We display contour plots of inundation level for fixed probabilities, and allow the users to manipulate the probabilities to see how inundation changes over the landscape. We additionally use small multiples to present the user with an overview of the inundation from a sample of individual simulations, showing the possible variety of outcomes over separate events. Our hope is that by showing both the aggregate data and the data for individual simulations, we can reduce the level of abstraction in the uncertainty measures that are typically reported. To further improve user comprehension of our data, provide context, and generate interest we embed our visualizations in an article-style narrative structure.
We would like to thank Professor Randy LeVeque for suggesting the project and for the providing the data that went into the tsunami simulations.
The techincal report and Github repository were invaluable tools in our effort to complete this project.
We would also like to thank Professors Ann Bostrom and Dan Abramson for their helpful discussions
and Professor Heer and Halden for their feedback during the milestone review.
On the coding side, Mike Bostock's d3-scale-chromatic
and Susie Lu's d3-legend were extremely helpful in producing a polished finished product.
We also made heavy use of examples from the w3schools.
Of course, none of this would have been possible without the Google Maps API and D3.
And finally, we would like to thank the A3-wildfires group (Charlie Godfrey, Kelsey Maass, Connor Sawaske, and Saumya Sinha) for their instrumental help in getting us started on using the Google Maps API with D3!