Mapping dengue vulnerability in Peru
 |
 |
 |
Team members:Charles Godfrey, Kelsey Maass, Connor Sawaske and Saumya Sinha
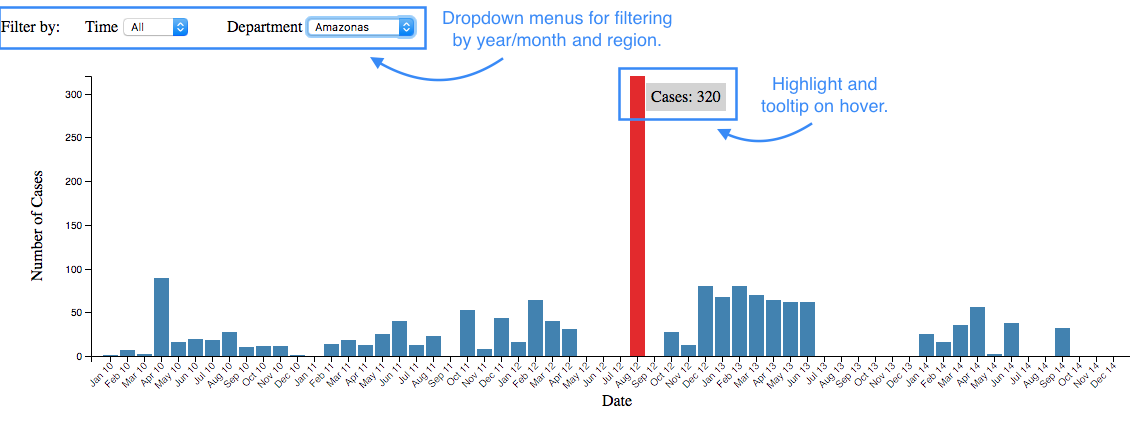
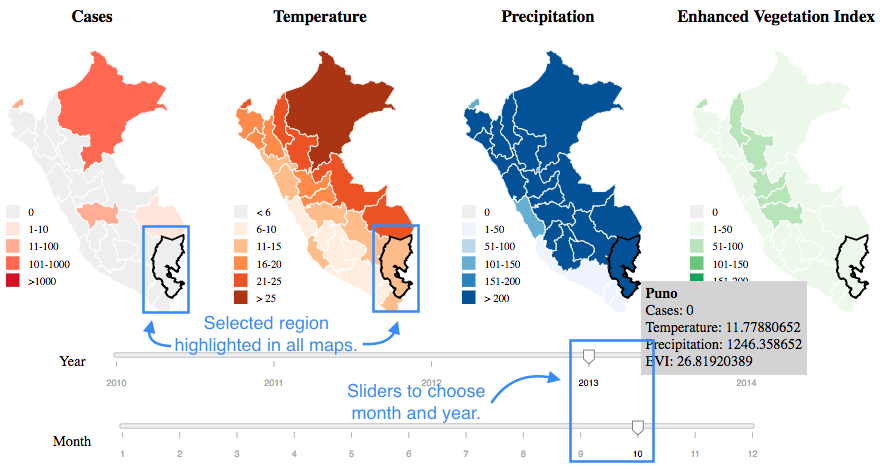
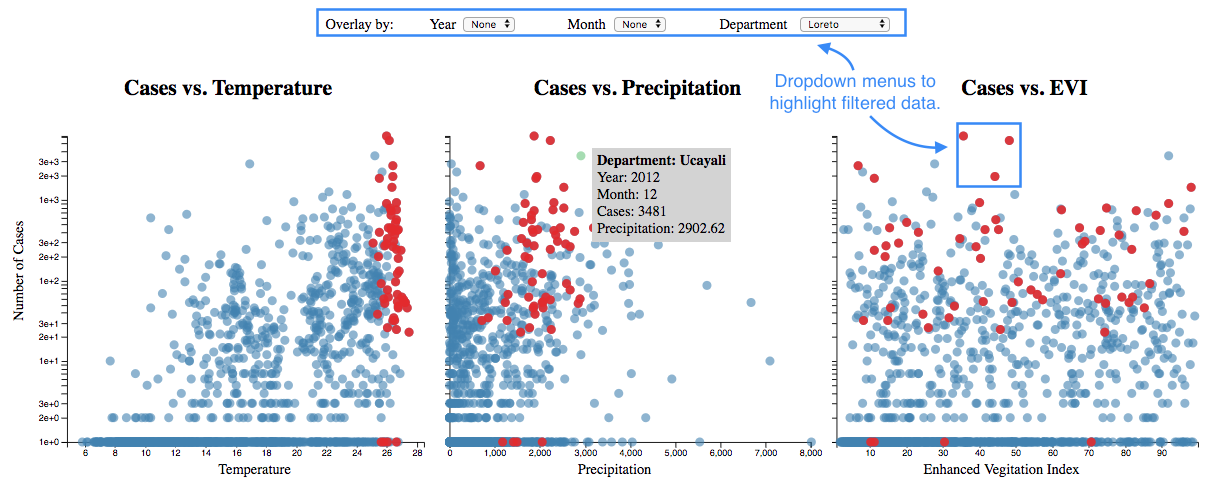
Abstract:Mosquito-borne illnesses pose a severe health risk to the people of Peru, and a key step in their containment is the identification of high-risk areas for efficient deployment of preventive resources. This can be facilitated by providing data-driven analytical tools to healthcare providers and policy-makers. To this effect, we develop an interactive visualization tool that displays the incidence of dengue in each administrative division of Peru per month over the years 2010 to 2014. The interaction is designed to allow a user to observe temporal as well as geographical trends. In particular, the tool assists in identification of high-incidence regions and establishing visual correlation between incidence and climatic factors like temperature and precipitation.
Data Sources:The primary source of data for this project was the UW MetaCenter for Global Disease Preparedness. Additional sources are listed below.
- Dengue case data provided by Ministerio de Salud del Peru, Dirrecion General de Epidimiologia
- Temperature and precipitation data provided by the Climatic Research Unit, University of East Anglia
- GeoJSON data for the administrative departments of Peru found on GitHub, converted from shapefiles provided by the Ministerio del Ambiente del Peru.
To read more about our project, follow the links to our paper and poster.